Interwest Safety Supply, LLC

An illustrated graphic of cars driving down a highway

U.S. Highway Statistics (Updated in 2022)

The Federal Highway Administration (FHWA) and National Highway Safety Administration (NHSA) annually report vehicle statistics including accident rates, motor vehicle fatalities, and monthly miles driven on highways. These statistics show how the average American is driving and whether efforts to improve highway safety are working.

In this article, we’ve compiled a list of U.S. highway statistics from 2022 sources—along with brief explanations of critical points—to illustrate traffic trends in the past few years.

U.S. Highway Statistics Accident Rate

Early projections of 2021 US traffic fatalities show that an estimated 42,915 people died in motor vehicle crashes. Behind each number is a life tragically lost and a family left behind. 

2021 saw a 10.5% increase in motor vehicle fatalities from 2020, the highest annual percentage increase in the history of the Fatality Analysis Reporting System. This is, at least in part, because fewer miles were driven in 2020 due to the Covid-19 pandemic and the subsequent lockdown, which reduced accidents.

A vector image of cars traveling on a road. A statistic reports 42,915 motor vehicle deaths occurred in 2021

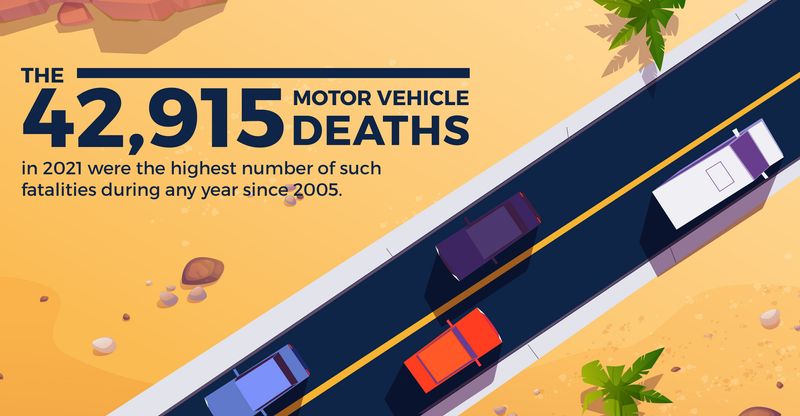
  • The 42,915 motor vehicle deaths in 2021 were the highest number of such fatalities during any year since 2005.
  • According to early estimates, the fatality rate in 2021 was 1.33 fatalities per 100 million vehicle miles traveled. This is down marginally from 2020 (1.34 fatalities per 100 million miles).

The number of fatalities rose in the first quarter of 2021 before dropping in the next three quarters. The number of deaths by quarter:

  • Q1: 8,935
  • Q2: 11,135
  • Q3: 11,780
  • Q4: 11,065

The fatality rate per 100 million miles traveled was the lowest during the first quarter.

  • Q1: 1.25
  • Q2: 1.34
  • Q3: 1.37
  • Q4: 1.35

Typically, the number of traffic deaths per state depends on the size of the state. Below are the five states that saw the highest percentage increase in vehicle fatalities from 2020 to 2021.

  1. Idaho (+33.6%)
  2. Minnesota (+26.9%)
  3. Vermont (+24.2%)
  4. Nevada (+21.8%)
  5. New Jersey (21.4%)

Below are the five states which saw the lowest percentage increase (or highest decrease) in vehicle fatalities from 2020 to 2021.

  1. Wyoming (-11%)
  2. Nebraska (-6.4%)
  3. Maryland (-4.4%)
  4. Wisconsin (-2.8%) 
  5. Rhode Island (+0.0%)

Traffic Fatalities by Category

Vehicle fatalities in the following categories increased in 2021 (from 2020) by:

  • Fatalities in crashes involving multiple vehicles up 16%
  • Fatalities on roads up 16%
  • Fatalities among drivers aged 65 and older up 14%. This reversed the trend seen in 2020, where fatalities among drivers 65 and older decreased.
  • Pedestrian fatalities up 13%
  • Fatalities in crashes involving at least one large truck up 13%
  • Daytime fatalities up 11%
  • Motorcyclist fatalities up 9%
  • Bicyclist fatalities up 5%
  • Fatalities in speeding-related crashes up 5% (still higher than the pre-pandemic 2019 levels)
  • Fatalities in police-reported, alcohol-involving crashes up 5% (higher than in 2019)
  • Fatalities in accidents involving unrestrained occupants of passenger vehicles up 3% (Higher than in 2019)

Distracted Driving

Distracted driving—including talking, texting, eating, drinking, or messing with the audio system—is a major cause of traffic accidents as it takes drivers’ attention away from the task of safe driving. Below are the most recent statistics that illustrate the dangers of distracted driving.

An illustration of a yellow and red car in a head-on collision. In 2020, there were 3,142 fatalities caused by distracted driving

  • Sending or reading a text message takes your eyes off the road for five seconds. At 55 mph, texting for five seconds is equivalent to driving the length of a football field with your eyes closed. 
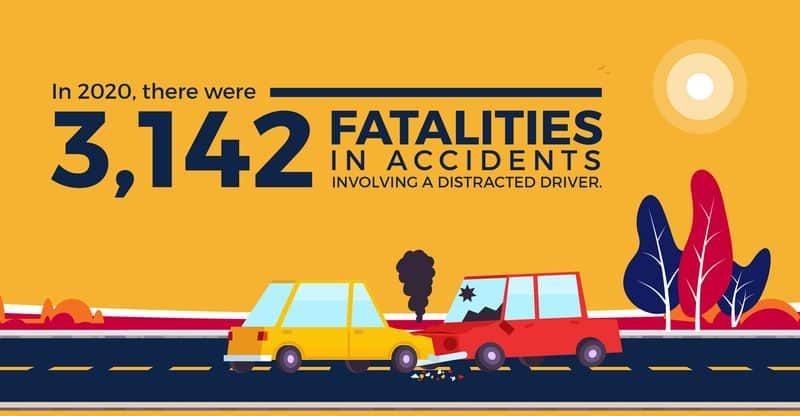
  • In 2020, there were 3,142 fatalities in accidents involving a distracted driver.
  • In 2019, over 3,100 people were killed and roughly 424,000 were injured in accidents involving a distracted driver. About 1 in 5 of those deaths were people who were not in a vehicle.
  • Nine people in the United States are killed every day in accidents involving a distracted driver.
  • The percentage of drivers talking on hand-held phones decreased from 2.9% in 2019 to 2.6% in 2020.
  • In 2020, 4.3% of drivers aged 16-24 visibly used a handheld phone while driving, the highest of any age group. 
  • A crash or ticket caused by distracted driving can increase yearly insurance premiums by more than $220.
  • Almost 9% of all fatalities are connected to distracted driving.

Distance Driven Statistics

  • Vehicle miles traveled in 2021 increased by 325 billion miles, or 11.2%, compared to 2020.
  • Miles traveled in 2021 were 1% lower than in 2019.
  • The average annual motor gasoline consumption was 9.3 million barrels a day (b/d) in 2019, 8.1 million b/d in 2020, and 8.8 million b/d in 2021.
  • The Energy Information Agency projects an increase of 0.3 million b/d in 2022 and a less than 0.1 million b/d increase in 2023 as cars become more fuel-efficient.

The FHWA tracks the changes in traffic volume by month and year in each region of the United States. This data is seasonally adjusted to show true changes in vehicle miles traveled rather than seasonal changes in driving patterns. Here is the estimated data from the past 12 months (seasonally adjusted) to show how driving has increased since 2020.

  • April 2021: 248.6 billion vehicle miles traveled (+56.5% from April 2020)
  • May 2021: 259.7 billion vehicle miles traveled (+31.1% from May 2020)
  • June 2021: 267.2 billion vehicle miles traveled (+14.9% from June 2020)
  • July 2021: 267.6 billion vehicle miles traveled (+13.1% from July 2020)
  • August 2021: 261.1 billion vehicle miles traveled (+8.5% from August 2020)
  • September 2021: 265.4 billion vehicle miles traveled (+7.7% from September 2020)
  • October 2021: 266.8 billion vehicle miles traveled (+7.9% from October 2020)
  • November 2021: 279.4 billion vehicle miles traveled (+11.3% from November 2020)
  • December 2021: 278.3 billion vehicle miles traveled (+10.7% from December 2020)
  • January 2022: 274.4 billion vehicle miles traveled (+4.7% from January 2021)
  • February 2022: 276.4 billion vehicle miles traveled (+9% from February 2021)
  • March 2022: 274.8 billion vehicle miles traveled (+2.8% from March 2021)

Most Popular Cars of 2022

Which cars were on the road most during the early months of 2022? Car production has been affected by the pandemic as supply chain issues have caused a shortage of necessary computer chips. Below are the top five best-selling vehicles in the first quarter of 2022.

  1. Ford F-Series (140,701 sold)
  2. Ram Pickup (127,116 sold)
  3. Chevrolet Silverado (118,796 sold)
  4. Toyota RAV4 (101,192 sold)
  5. Jeep Grand Cherokee (75,117 sold)

The Tesla Model Y was sixth on the list, showing the rising popularity of electric vehicles.

Increase Highway and Community Road Safety at Interwest Safety Supply

At Interwest Safety Supply, we aim to improve road safety on highways and in communities by offering high-quality traffic signs and safety equipment to the government and highway construction industry. Our 3M certified products make essential signs more recognizable to drivers and our experienced staff is committed to providing you with fast and dependable service.

Click here to view our products and get a quote today.

Scroll to Top